
ARTICLE 06 / ELECTRIFICATION · PRODUCT STRATEGY · COMMERCIALIZATION
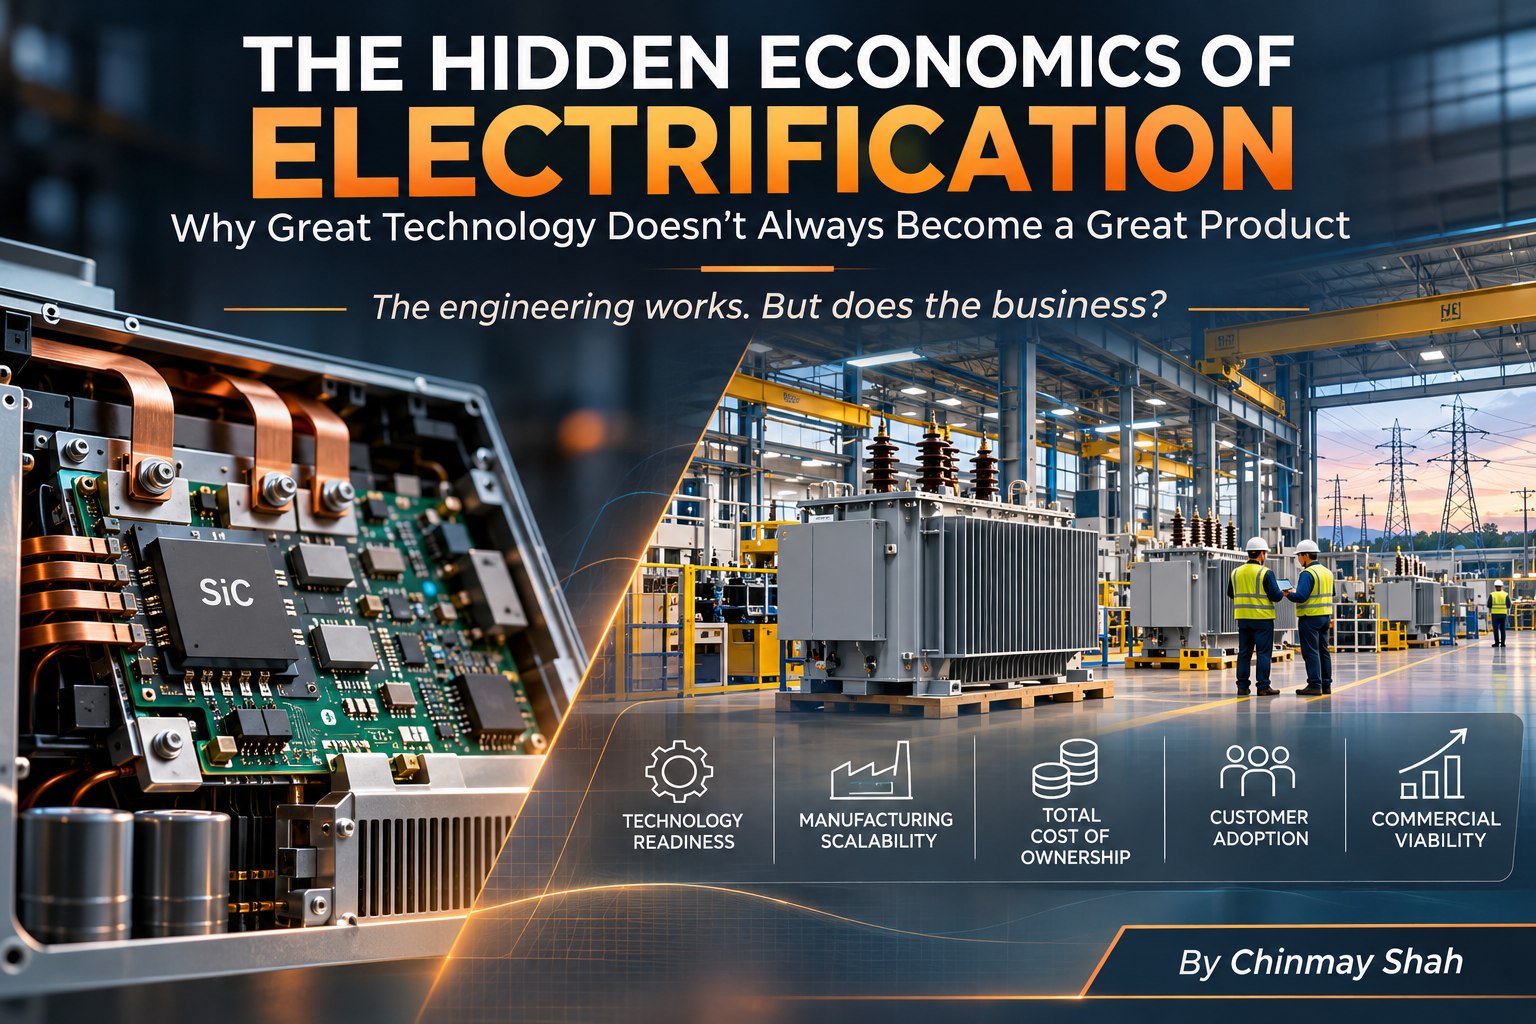
The technology works. But will the business?
Imagine two manufacturers developing next-generation power-conversion equipment. One delivers higher efficiency, more power density and advanced controls. The other offers adequate performance, easier integration, proven supply sources and faster delivery. Which will win?
The answer depends on the application—not the data sheet. A superior design can create exceptional value, but only when customers can measure that value, adopt the product, and justify its total cost. That is the hidden economics of electrification.
A technically superior product is not automatically a commercially superior product.
1 | A growing market is not the same as a profitable market
Electrification is expanding demand across grid infrastructure, battery storage, power electronics and data centers. Yet demand does not guarantee profitable growth for every manufacturer. In its Energy Technology Perspectives 2026, the International Energy Agency (IEA) describes a substantial overhang of solar PV and battery manufacturing capacity. Its August 2026 analysis puts the global market for six major energy technologies above USD 1.1 trillion in 2025. Both can be true: the opportunity is expanding and suppliers are under pricing pressure. [1, 2]
This challenges a common portfolio assumption: if the end market grows, our product should grow profitably with it. Not necessarily. Capacity, competing architectures, tariffs, substitution, service networks and procurement preferences determine who captures the value.
For a product leader, the harder questions are: which segment is underserved, what does it value, who is the alternative supplier—and can we win without destroying margin?
2 | Efficiency is a benefit. Payback determines its value.
Silicon carbide (SiC) power electronics can enable lower switching losses, higher switching frequency and more compact system designs. Those advantages may be important in high-utilization power conversion, but their commercial value depends on the duty cycle, electricity price, thermal design and installed-system cost. The U.S. DOE identifies SiC as an enabling technology for high-efficiency integrated-energy applications. [3]
Consider an illustrative 500 kW converter delivering constant output, with efficiency improving from 97.0% to 98.5%. At 6,000 operating hours per year and $0.12/kWh, lower input energy costs save approximately $5,652 per year. Against a hypothetical $30,000 premium, simple energy-only payback is roughly 5.3 years. Run only 2,000 hours annually, and the payback extends to about 15.9 years. These are assumptions, not market quotations.
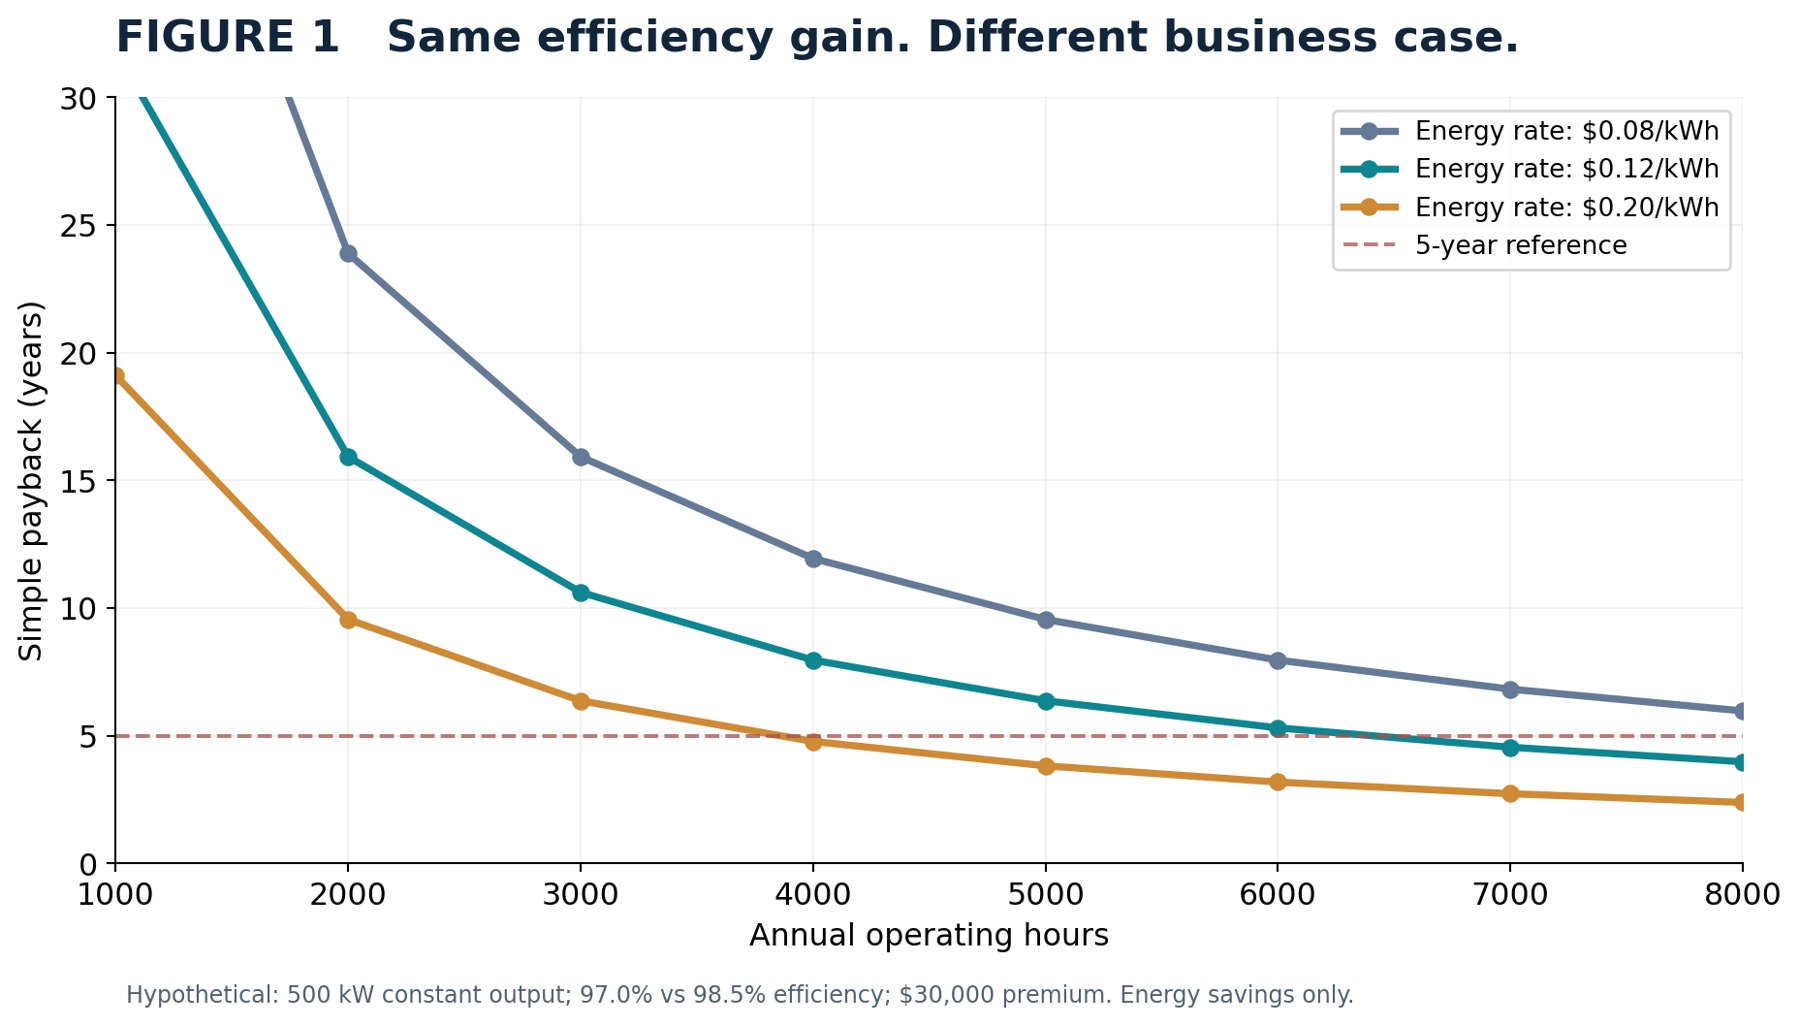
The decisive insight: “1.5 percentage points more efficient” is an engineering description. “Five-year payback under this customer’s operating conditions” is a commercial proposition. Cooling savings, demand charges, reliability, installation and financing could move the outcome materially in either direction.
3 | The real competitor may be doing nothing
A new solid-state transformer or advanced converter competes with more than other new products. It competes with established transformers, conventional power electronics, incremental retrofits and the customer’s option to defer an investment.
A laboratory demonstration may validate electrical performance without resolving protection coordination, site certification, technician training, spare-parts availability or service-life expectations. Customers evaluate implementation risk as well as nominal performance. A system that requires a new operating model must deliver enough value to justify the disruption.
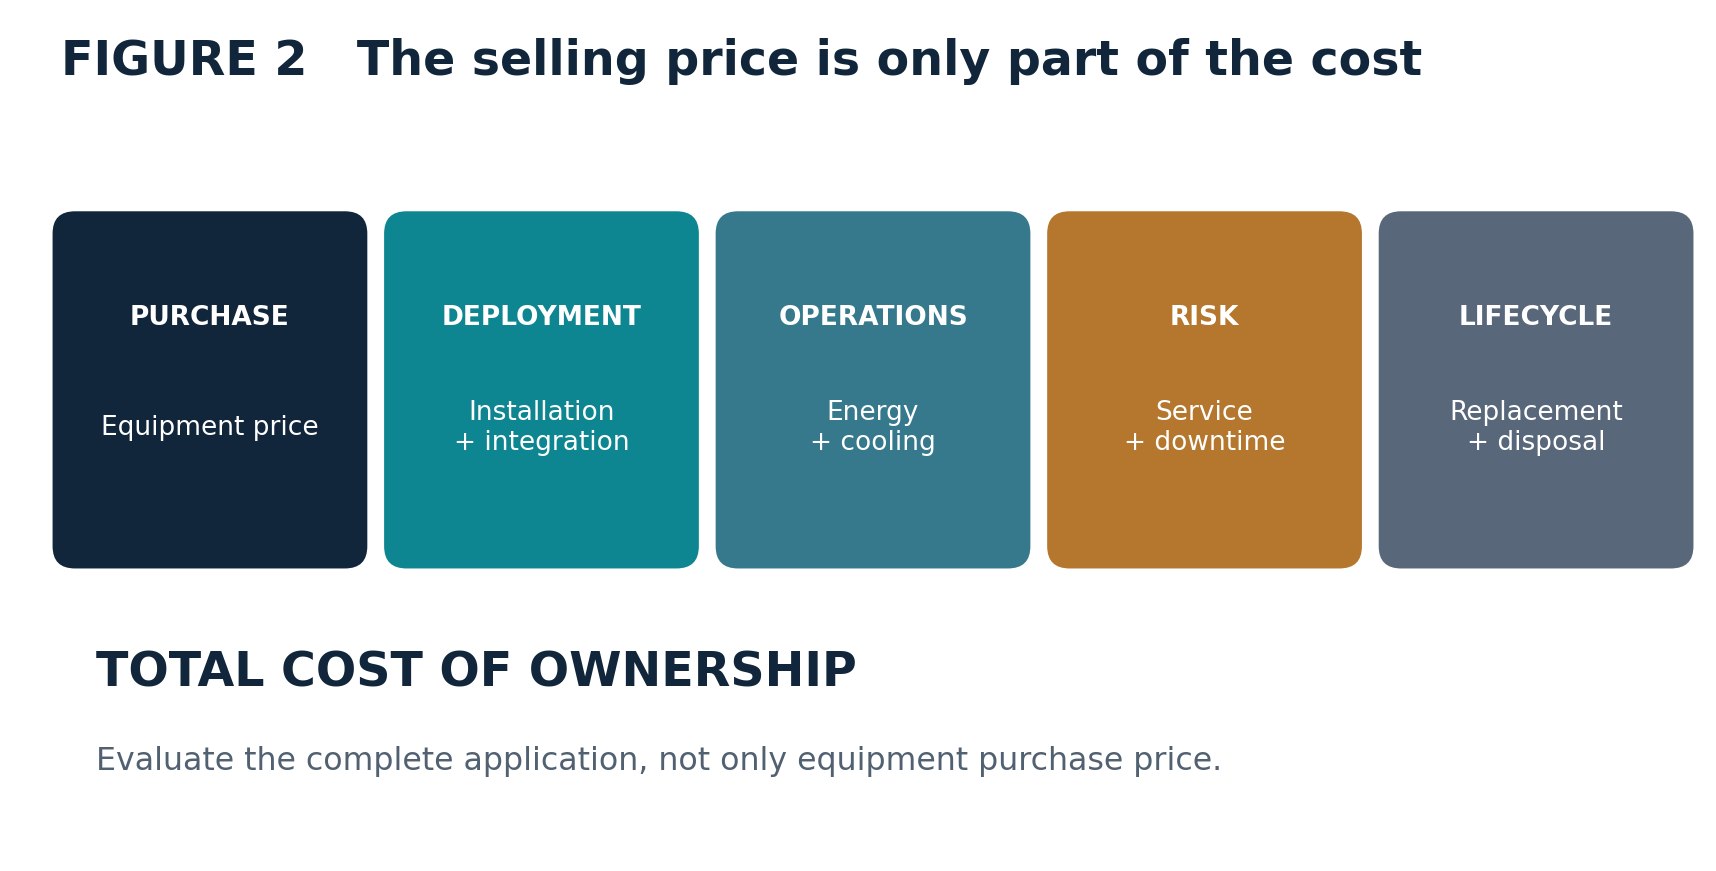
The competitive comparison belongs at the system level—not at the component level.
4 | Manufacturing economics can reverse the design ranking
In prototyping, the question is “Can we make it work?” At scale, it becomes “Can we repeat it, support it and earn an acceptable return?” A custom design can meet every specification but require unique tooling, long-lead components, intensive tests, high inventory and specialized field support.
A platformed alternative might surrender some peak performance while improving yield, capacity utilization, supplier resilience and delivery reliability. The DOE reports that distribution transformer lead times rose from about 3–6 months in 2019 to 12–30 months in 2023 amid supply constraints. That is historical evidence, not a claim that those lead times still apply to every transformer today. [4]
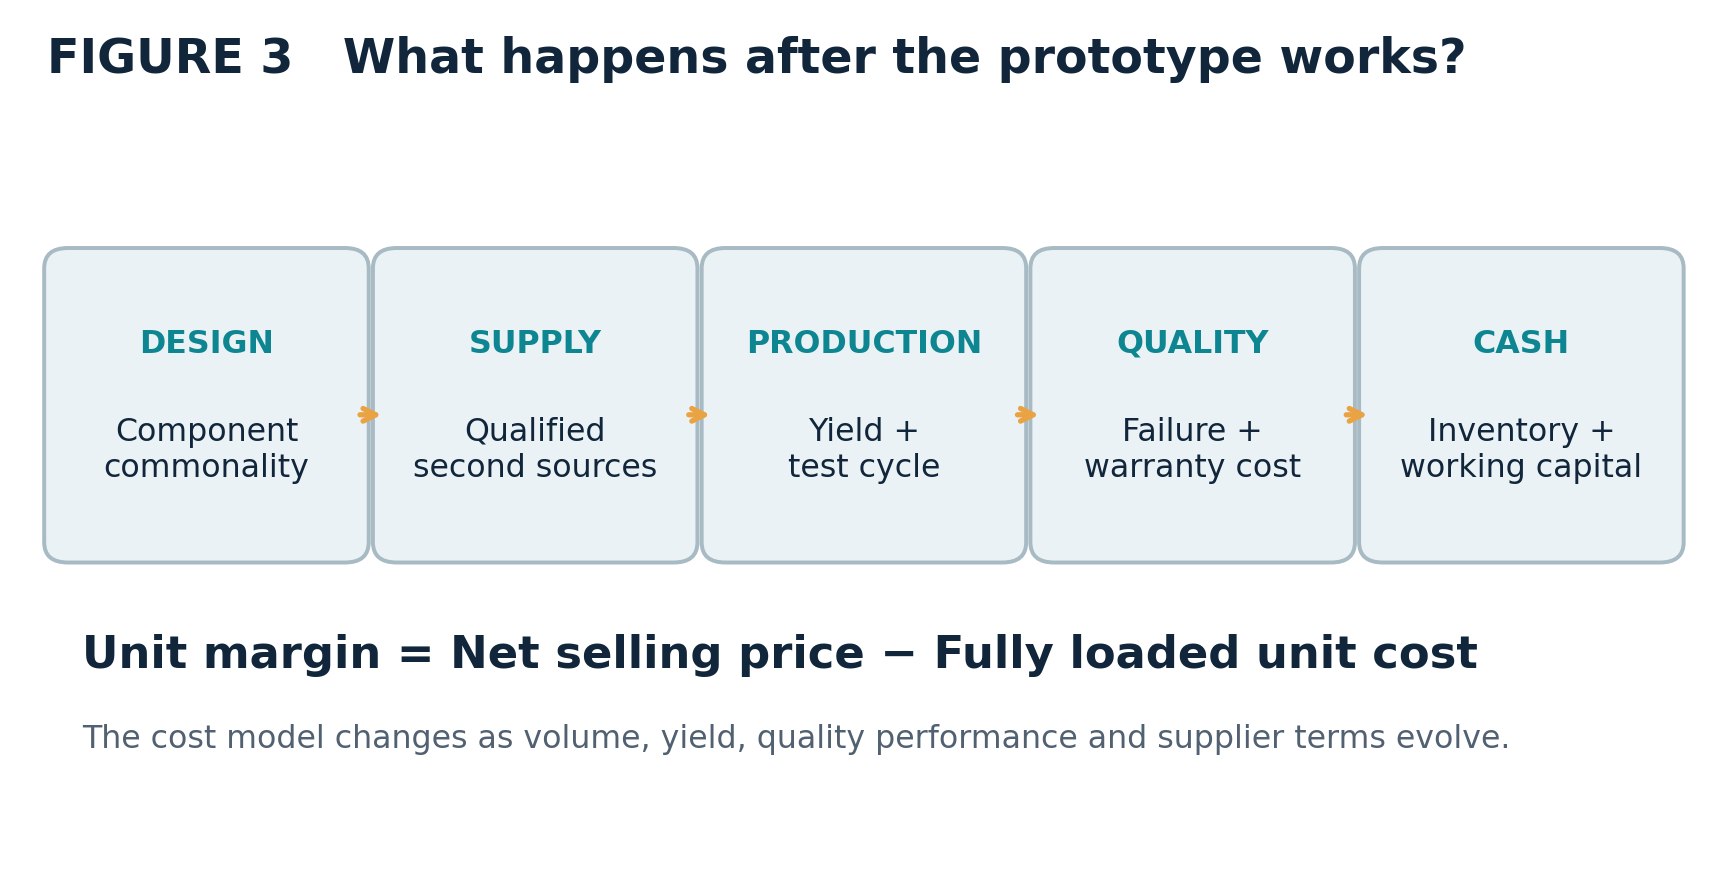
The real financial equation includes recurring gross margin, non-recurring engineering, warranty risk, inventory, working capital and cash timing. An attractive bill of materials can still support a weak business case.
5 | Five evidence gates for commercializing innovation
Rather than allowing technology milestones alone to release the next investment, I would use five connected evidence gates. They are a practical proposal—not a universal industry standard:
Customer value — A defined buyer confirms the problem, measurable value and purchasing process.
Technology readiness — Performance, safety, reliability and system interfaces work under representative conditions.
Manufacturing readiness — Qualified suppliers, repeatable yield, cycle time and fully loaded unit cost support volume.
Commercial viability — Price, margin, warranty, working capital and return on investment remain viable under downside scenarios.
Adoption readiness — Certification, integration, procurement, operations and service ecosystem can support deployment.
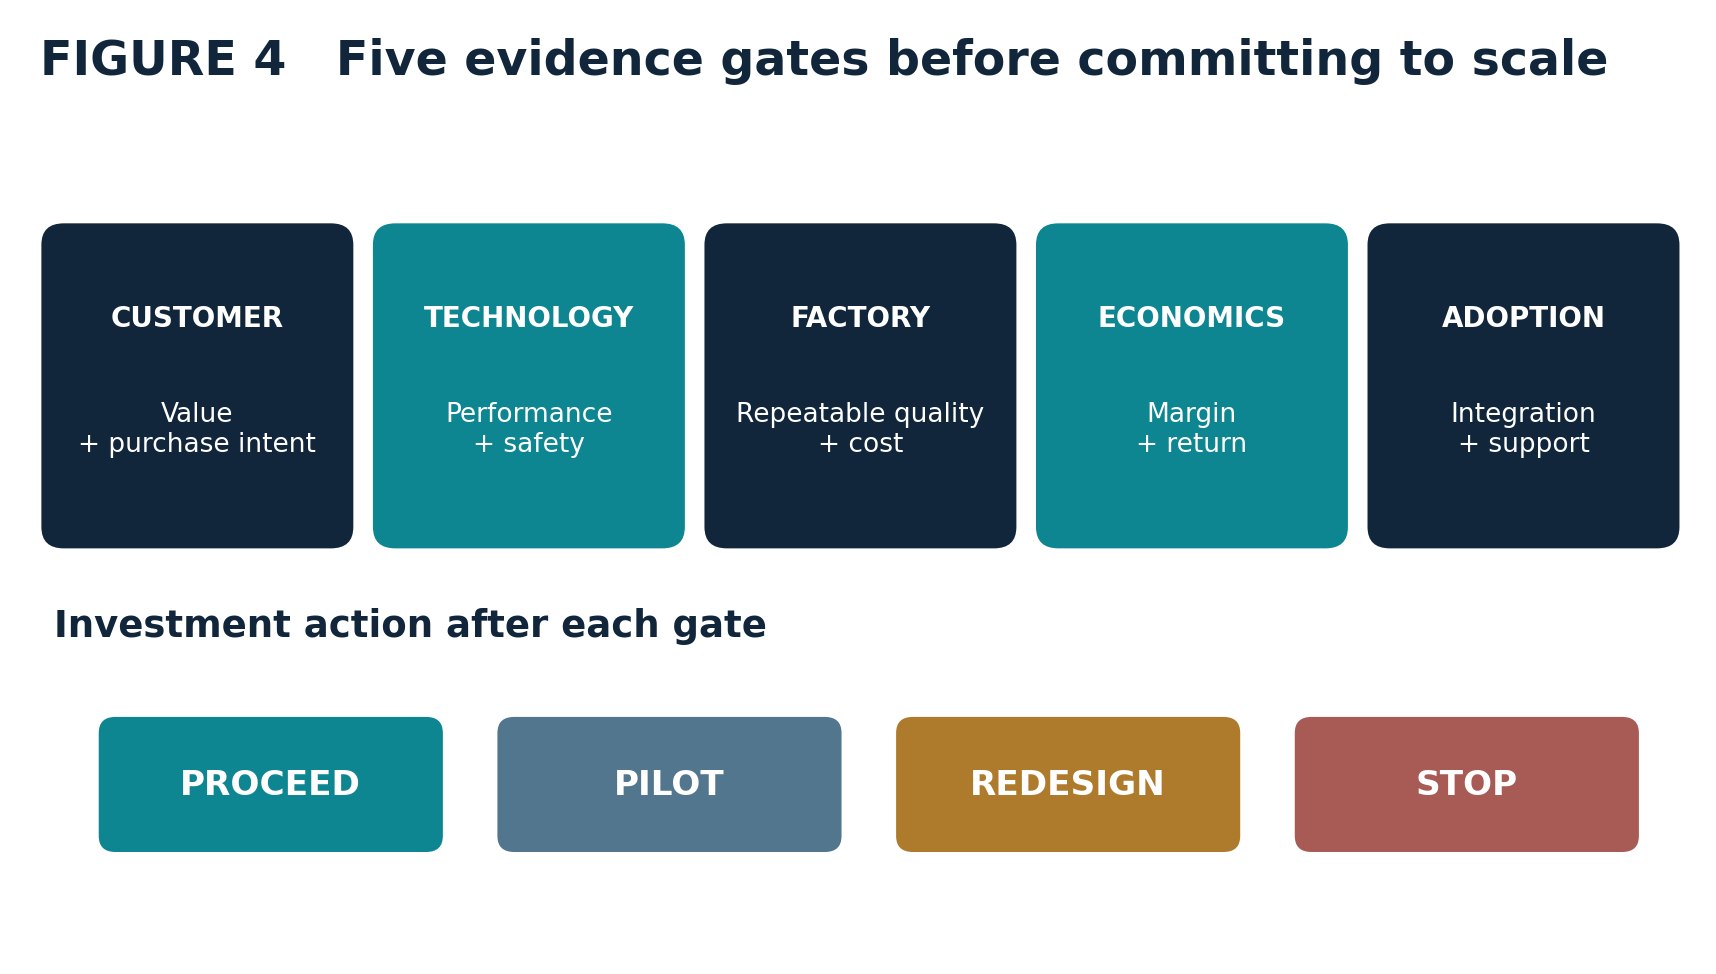
Each gate should lead to a decision: proceed, run a controlled pilot, redesign the offer, or stop. A funded pilot with explicit performance and economic acceptance criteria is much stronger evidence than a positive demonstration meeting.
6 | The argument against this approach
An overly rigid return-on-investment test can also destroy future opportunities. Emerging technologies often require infrastructure development, learning-curve investments, standards work and strategic patience. Early unit economics may misrepresent the eventual market. Regulatory requirements or resilience benefits may also justify adoption even when simple energy payback looks unattractive.
Therefore the answer is not “only launch products with short paybacks.” It is to separate measurable near-term economics from credible longer-term option value—and fund both with appropriate evidence, milestones and risk limits.
The decision that separates innovation from product strategy
Electrification needs bold engineering. But successful commercialization requires something more: an explicit connection between technical capability, customer economics, repeatable manufacturing and adoption readiness.
The most important question is not simply “Can we build better technology?” It is “Can we turn it into a product customers value, can adopt and will continue buying at a sustainable price?”
For product and engineering leaders: which barrier most often changes the investment decision in your organization—customer payback, manufacturing scale, qualification, or something else?
Sources and methodology
- [1] IEA — Energy Technology Perspectives 2026: Energy technology manufacturing and trade
- [2] IEA — Energy technology manufacturing is rebalancing (3 August 2026)
- [3] U.S. DOE — Silicon Carbide in Integrated Energy
- [4] U.S. DOE — Supply Chain and Market Analysis
Illustrative conversion model: annual savings = 500 kW × hours × (1/0.97 − 1/0.985) × electricity tariff. Constant delivered power assumed; excludes parasitic cooling loads, degradation, financing and demand charges. All figures and the five-gate framework are original explanatory illustrations, not primary experimental data.
